The collection of FOD numbers is a set of integers that establish the boundary conditions for a piecewise linear function, which is defined for all x in the domain of the FOD set and its expansions. The domain of x is defined:
(1) The Simple Forward Wave [skip to next]
The process by which the 384 number data set is generated begins with the King Wen sequence of I-Ching hexagrams (a listing of which appears in the Time Explorer manual, pp. 58-59), which is believed to be the earliest arrangement of hexagrams. McKenna chose to examine [4] the number of lines that change (yin to yang, and yang to yin) as one moves from hexagram to hexagram, beginning at hexagram 1 and proceeding to hexagram 64, and he called this quantity the First Order of Difference (FOD). The FOD number set that is generated as one moves from hexagram 1 to hexagram 64 contains 63 elements; a 64th element is determined by recording the FOD as one moves from hexagram 64 "wrapping" back to hexagram 1, thus establishing a closed system with periodic waveform. This FOD number set can be computed mathematically by treating each hexagram as a binary number as reported by Meyer [5] but in this case I simply recorded each number manually in DeltaGraph [6] and Excel [7] spreadsheets.
The FOD number set, which I will now call the Simple
Forward Wave [8] , is graphed
in Fig. 1 with straight line segments connecting the individual FOD data
points. The x-axis of this graph shows the hexagram transition number,
where transition n is defined as the transition from hexagram n
to hexagram n+1; transition n=0 is simply an x-axis
wrap of transition 64, and is thus defined as the transition from hexagram
64 to hexagram 1. The inclusion of the zero transition data point is a
way of graphically illustrating the "wrap-around" nature of this number
set, or possibly a way of mapping a 3-dimemsional cylindrical surface onto
a 2-dimensional plane. For clarity, let us define this feature of the FOD
number set:

(2) The Simple Reverse Wave
In order to clarify the process of simple bi-directional wave generation, and the production of the Simple Reverse Wave, let us first define another general principle:
This rotation operation can be visualized by observing that the Simple Forward Wave, shown in quadrant I (upper right hand corner of Fig. 2a) is fixed relative to the x, y axes (red lines). The axes are then spun counter-clockwise 180° around their origin (intersection point), carrying the wave with them. The mathematical formulas for this rotation are expressed as:
Where: ![]() is the rotated
is the rotated ![]() value
value
![]() is the rotated
is the rotated ![]() value
value
![]() is the angle of rotation in degrees
is the angle of rotation in degrees
With 180° as the rotation angle, these equations reduce
to:
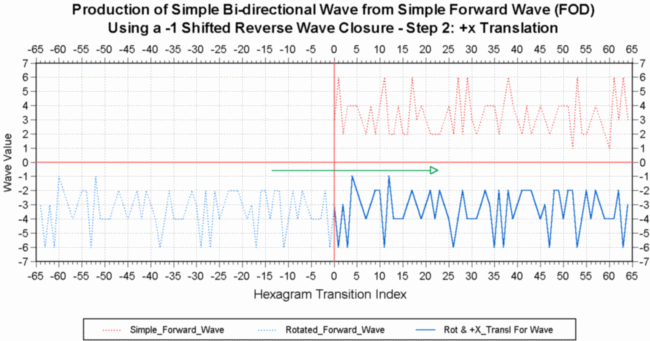
Equation [3] and [4] show that this 180° rotation operation results in a simple sign change of the original forward wave x, y pair data set. The rotation places the developing reverse wave in quadrant III of the graph, shown as the solid blue line-plot. The dotted blue line-plot shows the position of the parent Simple Forward Wave.

Step 2 of the reverse wave generation process is shown
in Fig. 2b, and involves the translation of the rotated forward wave in
the ![]() direction. This operation is expressed by the following translation equation:
direction. This operation is expressed by the following translation equation:
Where: ![]() is the translated value of
is the translated value of ![]() of equation [3]
of equation [3]
![]() is the magnitude of the translation in the
is the magnitude of the translation in the ![]() direction
direction
Since this translation must x-align the endpoints
of the forward and reverse waves, the magnitude of the translation, ![]() ,
is +64. This positions the developing reverse wave in quadrant IV as shown
in Fig. 2b.
,
is +64. This positions the developing reverse wave in quadrant IV as shown
in Fig. 2b.

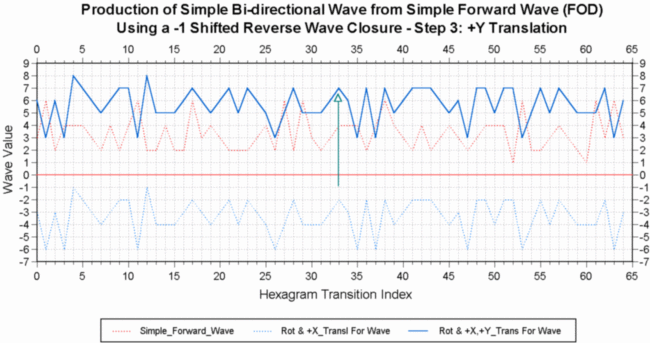
Fig. 2c shows Step 3 of the reverse wave generation process,
and is defined as the ![]() translation of the x-translated wave of Fig. 2b. This translation is performed
so that the forward and reverse waves will be in position to achieve closure
at the Index 1 and Indices 62, 63, 64 endpoints as specified by definition
3, once the next and final step is performed. The translation equation
for this step of the process is express as follows:
translation of the x-translated wave of Fig. 2b. This translation is performed
so that the forward and reverse waves will be in position to achieve closure
at the Index 1 and Indices 62, 63, 64 endpoints as specified by definition
3, once the next and final step is performed. The translation equation
for this step of the process is express as follows:
Where: ![]() is the translated value of
is the translated value of ![]() as expressed in equation [4]
as expressed in equation [4]
![]() is the magnitude of the translation required to position the reverse wave
for proper closure with the forward wave
is the magnitude of the translation required to position the reverse wave
for proper closure with the forward wave
In this case the ![]() positioning for proper wave closure requires a
positioning for proper wave closure requires a ![]() value of +9. Fig. 2c shows the reverse wave position that results from
this translation, and also shows that the forward and reverse waves are
offset, and have not yet achieved endpoint closure. The next and final
step is performed using a different type of mathematical operation called
the "shift", which can be understood by using the following analogue:
value of +9. Fig. 2c shows the reverse wave position that results from
this translation, and also shows that the forward and reverse waves are
offset, and have not yet achieved endpoint closure. The next and final
step is performed using a different type of mathematical operation called
the "shift", which can be understood by using the following analogue:

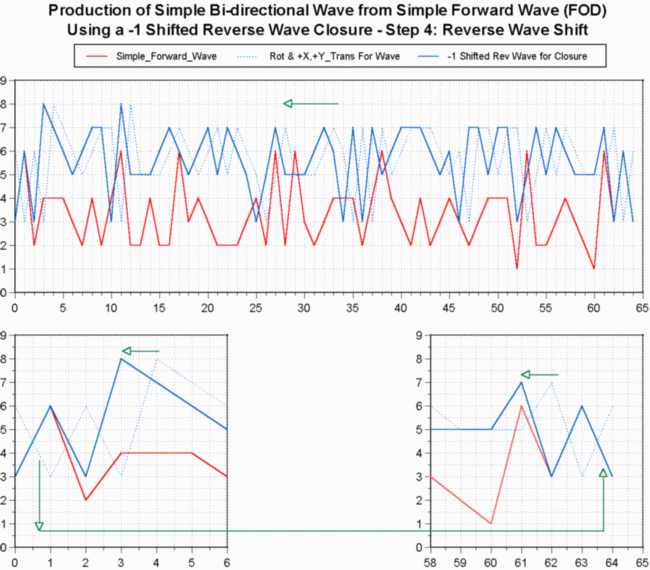
This final step, the -1 ![]() -shift,
is shown in Fig 2d, where the dotted blue line-plot is the pre-shifted
reverse wave position, and the solid blue line-plot is the -1 x-shifted
reverse wave position. The larger plot at the top shows the shift operation
for the overall wave pair, whereas the two smaller plots at the bottom
of Fig. 2d are magnifications showing the closure process at the beginning
and end sections of the wave pair. The mathematics for this operation can
be expressed as a two step process as follows:
-shift,
is shown in Fig 2d, where the dotted blue line-plot is the pre-shifted
reverse wave position, and the solid blue line-plot is the -1 x-shifted
reverse wave position. The larger plot at the top shows the shift operation
for the overall wave pair, whereas the two smaller plots at the bottom
of Fig. 2d are magnifications showing the closure process at the beginning
and end sections of the wave pair. The mathematics for this operation can
be expressed as a two step process as follows:
For ![]()
Where ![]() is defined:
is defined:
such that: ![]() is the y value of the -1 x-shifted wave at x
is the y value of the -1 x-shifted wave at x
and: ![]() is the y value of the pre-shifted reverse wave at x
is the y value of the pre-shifted reverse wave at x
There are two features of Fig. 2d that should be noted here. First notice that in the small graphs at the bottom, closure between the forward and reverse waves occurs at four transition axis points (excluding zero). These points are x = 1, x = 62, x = 63, and x = 64, so that wave closure occurs at one initial point (x = 1) and three terminal points. Point zero is excluded since it is simply a "wrap", or duplicate, of point 64 and will eventually be discarded. Secondly, the two smaller graphs at the bottom of Fig. 2d show the process of endpoint shift, or transferring the "marble/line segment" that was initially in slot 0 into the vacated end slot 64. The green arrow line runs from line segment 1 in the graph at the left, to line segment 64 in the graph at the right, and shows that segment 1 is being transferred to segment 64 as the -1 x-shift is performed. The figure shows that this is not a simple translation operation as in the previous two steps, but a definite shift - much like the operation of a shift register in digital electronics. Note that if a simple -x translation were performed, line segment 1 would be translated into the negative x -domain to the left of the y-axis, and there would be no line segment 64.
With the performance of the -1 x-shift operation,
the production of the Simple Bi-directional Wave is now complete.
We have thus created a forward and reverse flowing waveform, which is closed
at either end, something like nodes on a standing wave. Although this is
the correct procedural process for generating the reverse wave from the
forward wave, and for producing endpoint closure, the relationship between
forward and reverse waves can be expressed simply by the following equations:
For ![]()
Where ![]() is defined:
is defined:
and where: ![]() is the y value of the reverse wave at x
is the y value of the reverse wave at x
![]() is the y value of the forward wave at (63 -x)
is the y value of the forward wave at (63 -x)

Equations [9] and [10] are good examples of mathematics that do the job, but fail to give one a visual image or sense of what is really going on in the process. This type of math is actually quite useful, nonetheless, for computer generation of the reverse wave number set.
We have thus created a simple bi-directional waveform,
having the properties of directed flow and endpoint closure, and which
can be characterized as a piecewise linear function - a function we have
yet to define over its non-integer domain. That will be our next step in
the formalized development of the TimeWave data set.
[continue] [results & conclusions] [index] [hyperborea] [back]