(1) The TimeWave Zero Screen Set Comparisons [index]
Once the Data Wave, or 384 number data set has been generated, it becomes the input data for the TimeWave Zero software package. As mentioned previously, the software performs what has been called a fractal transform, or expansion of the 384 data number set to produce the TimeWave viewed on the computer screen as a graph of Novelty. In order for this fractal expansion to be performed properly, the software requires that the 384 number data set shown in Fig. 10 be reversed, such that data point 384 becomes data point 1 and data point 0 is discarded (since itís a duplicate or wrap of data point 384).

Three separate data sets were used in order to generate
the TimeWaves needed for comparison - the standard data set,
the revised data set, and a random data set. The results
of some of these TimeWave comparisons will be shown in the graphs
that follow, beginning with the default TimeWave graphs that are
included with the TimeExplorer software as pre-computed waveforms.
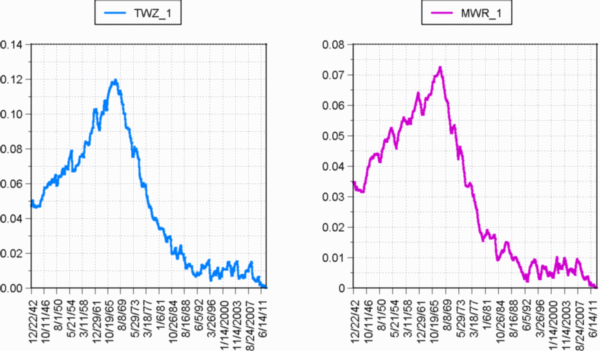
Figs. 15a and 15b show the TimeWave that is stored by the software
as Screen 1, and it covers the period between 1942 and 2012. Fig. 15a shows
both the TimeWave resulting from the standard data set on
the left, and that for the revised data set on the right. On the
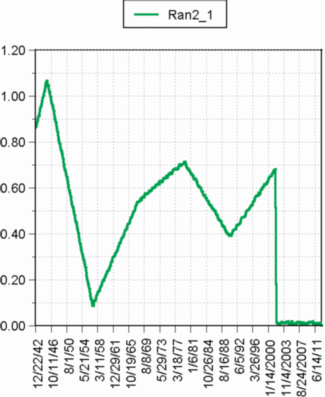
other hand, Fig. 15b is the TimeWave generated by the random
data set, and it clearly bears little resemblance to the graphs of Fig.
15a.
This is the TimeWave graph that McKenna has called
"history's fractal mountain", because of its mountain-like shape. There
are several features to notice here, with the first being that these two
plots have remarkably similar shapes - obviously not identical, but there
is clearly a common dominant process at work. Another common feature of
significance shown in these two graphs, is that the major decent into Novelty
(peak of the mountain) begins sometime in 1967. Finally, as mentioned earlier,
the TimeWave produced by the revised Data Wave number
set, shows a higher average level of Novelty for this time period
(lower values), than does the TimeWave produced by the standard
data set. This Novelty difference is the likely result of the
standard wave distortion, caused by the imbedded
mathematical errors that produce significant high frequency noise in the
wave. As shown in Fig. 14, the high frequency components of the revised
data wave are lower than the standard wave by an order of magnitude.
Fig. 16a shows the standard and revised TimeWave graphs
for Screen 4 of the TWZ display. Again, these two plots are quite similar
in terms of their appearance, and seem to be showing evidence of some common
underlying process. The differences may be due to the fact that the standard
number set produces more high frequency noise because of the imbedded errors
in the number set. The correlation between these two graphs was found to
be 0.731, not as high as Screen 1, but still a significant correlation
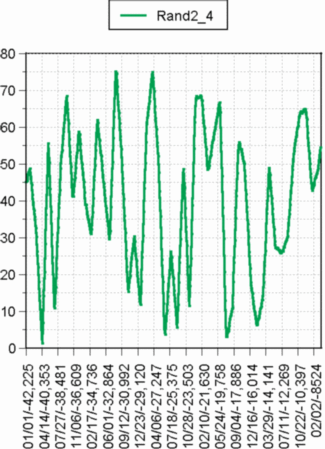
nonetheless. On the other hand, the random data set TimeWave shown in Fig.
16b, shows very little correlation

with either of the graphs in Fig. 16a. This is expected, since random number sets are by definition, un-correlated with any other number set.
A complete set of comparisons like those shown in Figs. 15 and 16 were performed on all the TimeWave Zero screen sets (Screens 1-10) with very similar results. The correlation results for the TWZ Screen set comparisons ranged from a low of 0.73 to a high of 0.98 with an average correlation of 0.86, showing that the standard and revised TimeWaves in this screen set were remarkably similar. This was not the case for other TimeWaves that were examined, which will be shown later. In other cases of TimeWave comparison, the differences between the standard and revised waves, appears to show that the revised TimeWave expresses a Novelty process having better alignment with known historical process ñ something one would expect from a more precise formalization process. More analysis is certainly in order, but the data thus far seems to make that case.
(2) Comparisons for Other Significant Historical Periods
Several other TimeWave periods having historical significance were examined for comparison, but the two reported here are the periods from 1895-1925, and from 1935-1955. The first period includes major advances in physics and technology, as well as a world war; and the second period includes the development and use of nuclear weapons, as well as two major wars. Fig. 17 is a graph of the TimeWave comparison for the 1895-1925 period, and again these plots are remarkably similar in form. Several significant dates are marked with green and red arrows to signify Novel and Habitual phenomena. The first powered flight happens at Kittyhawk on December 17, 1903; followed by Einstein's Special Theory of Relativity (STR) on June 30, 1905; General Relativity in 1915, and the World War I period of 1914-1918. The events that would be considered novel (manned flight and breakthroughs in physics) all occur at Novelty troughs or Novelty descents. The Habitual phenomenon (war), on the other hand, appears to drive what seems to be a very novel period, back into habit. When both novel and habitual phenomenon are occurring simultaneously, they both influence the shape of the TimeWave. WWI may have driven the wave further into habit than it did, if it weren't for the simultaneous occurrence of very novel phenomena. For example, the work on the General Theory of Relativity occurs in the midst of World War I with its "Same 'OLE" habitual nature. The more novel process of a significant advancement in scientific knowledge, actually appears to suppress what would have been a major ascent into habit, and actually driving the wave into novelty troughs.
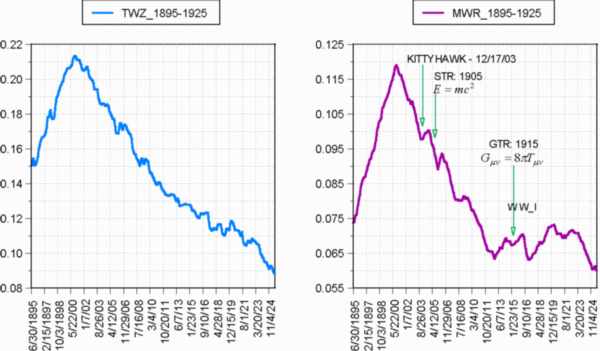
Fig. 18 shows the 1915 time period, for which the two waves exhibit a substantial disagreement. With the exception of a brief two-month period, the standard TimeWave shows a steady descent into Novelty. The revised TimeWave, however, shows more of what one might expect for a planet embroiled in global conflict. Additionally, the revised TimeWave shows several instances where the determined march into habit is either slowed or temporarily reversed; and with the publication of the general theory in early 1916, the level of Novelty becomes too great for the forces of habit, and the wave plunges. This figure provides a good example of how the standard and revised TimeWaves can exhibit behavioral divergence, and how this divergence tends to affirm the improved accuracy of the revised waveform. Let us now take a look at another period that most of us are familiar with - the period that includes World War II, nuclear energy development, and the Korean War.
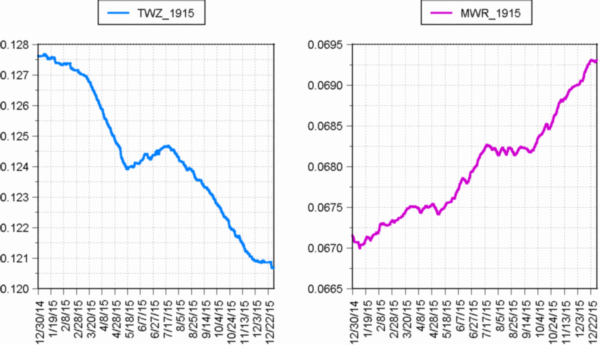
Figure 19 shows the standard and revised TimeWave comparison
graphs for the period 1935-1955, and there are obvious similarities and
clear differences between the two waves. Both graphs show that WWII begins
and ends during steep ascents into habit, but they describe somewhat diverging
processes, for much of the middle period of the war. The revised TimeWave
shows that a very novel process is apparently at work for much of the period
of the war. The standard TimeWave does show novel influences, but it is
neither as consistent nor dramatic as for the revised TimeWave. Some very
potent novel process seems to be occurring during much of the war period,
and that process may be suppressing a major ascent into habit that might
otherwise be happening. Could this novel process be the development of
nuclear science and technology, eventually leading to the production and
use of nuclear weapons? That may be an offensive notion, but let's take
a closer look at it.
The development of nuclear science is really about becoming more aware and knowledgeable of a process that powers the sun and the stars - more aware of just how a very powerful aspect of nature works. What one then does with such knowledge is a different process entirely - and largely a matter of consciousness and maturity. As we can see from the revised TimeWave graph, the moment that this knowledge is converted to weapons technology - the nuclear explosion at Trinity Site in New Mexico - the wave begins a steep ascent into habit.
The use of this awesome power against other human beings in Hiroshima and Nagasaki occurs shortly after the test at Trinity Site, and occurs on a very steep ascending slope of habit. Perhaps the process of becoming more aware of nature, and ourselves - is very novel indeed. It is the sacred knowledge of the shaman, who returns from an immersion into an aspect of nature, with guidance or healing for her or his people. We seem to have lost the sense of sacred knowledge with its accompanying responsibility, somewhere along the way. Perhaps it is time to regain that sense, and reclaim responsibility for our knowing.
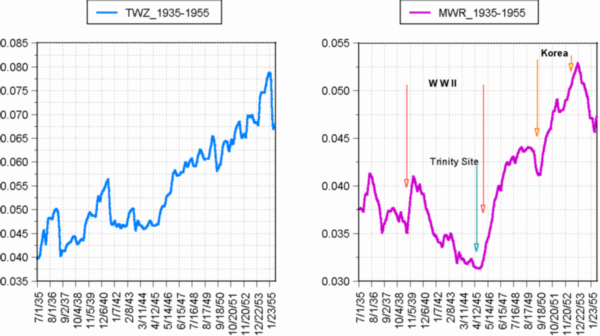
The revised TimeWave of Fig. 19 also shows the period
of the Korean war as a very steep ascent into habit, although something
occurring early in 1952 did momentarily reverse the habitual trend.
Correlation Data and TimeWave Comparisons
Correlation analysis was performed for all the data sets compared in this report, as well as the remaining eight TWZ screen sets not shown here, and selected time periods. This type of analysis allows us to examine the relationship between data sets, and estimate their degree of interdependence - i.e. how similar their information content is. The results of these analyses are shown graphically in Fig. 20, and they include the ten TimeWave screens included with the TWZ software, nine selected historical windows, and the 384 number data sets. In all cases shown, the revised and random data sets are being correlated (compared) with the standard data set. Since any number set correlated with itself, has a correlation coefficient of one, the blue line at the top of the graph represents the standard data self-correlation.
Recall that a correlation of 1 signifies number sets that have identical information content, a correlation of zero signifies no common information content, and a correlation of -1 means that the number sets information content exhibit "mirror image" behavior - wave peaks to wave valleys etc. The green line in the graph shows the degree of correlation between the revised waveform and the standard waveform, for each of the separate TimeWaves that were examined. The red line shows the correlation level between waves generated by the random seeded data sets, and those generated by the standard data set. The first point of each line, is the correlation coefficient for each of the 384 number data sets examined - random, revised, and standard data sets.
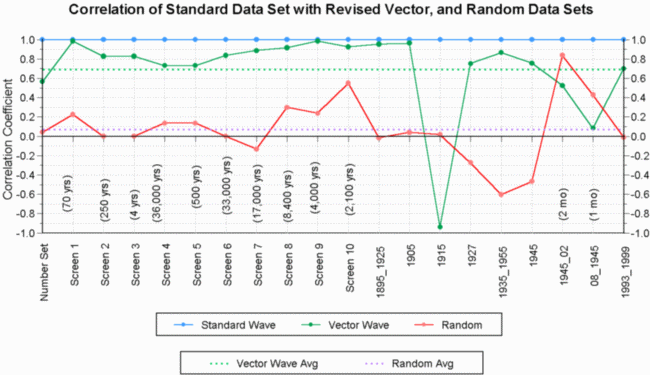
The first feature to notice about the revised and standard data set correlations shown in Fig. 20, is the fact that the revised 384 number data set shows a correlation with the standard number set of about 60% - a comparison that is shown in Fig. 12. This is a significant cross-linking of information content, and something that one might expect for number sets with a common base and very similar developmental procedures. The next feature of significance is the fact that the correlation between the revised and standard TimeWaves, for all ten TWZ screen sets, is better than 70% and as high as 98%, showing a very high level of interdependence. The time periods represented by these ten TimeWave screens, ranges from 4 years to 36,000 years, which is labeled on the graph. The duration of these TimeWave periods may have a bearing on the level of correlation, as we shall see in a moment.
Beginning with the period 1895-1925, the graph shows more scatter in the correlation between standard and revised data sets, which ranges from about 98% down to 8%, with one anti-correlation of -95%. Notice that the correlation appears worse for very short time periods, one to two months or so. One possible explanation is that the very short time period TimeWaves are generated by a very few data points - in other words a low wave sampling frequency or rate. A small, and under-sampled input data set would add a higher level of noise to the wave signal, and consequently produce the higher data scatter observed. The sampling theorem, from information theory, states that aliasing (noise generation) begins to occur when the signal sampling rate becomes less than twice the highest frequency component of the sampled signal. This is certainly something that may be occurring in the mathematics of TimeWave generation.
Additionally, as mentioned previously, this difference could be the consequence of having an improved model of the process. It is important to remember through all of this comparison analysis, that the standard data set is generated by a process with imbedded flaws - not enough to destroy the information content of the wave signals, but enough to cause some distortion of that information content. This correlation analysis is interesting, primarily because it leaves the standard TimeWave intact, more or less - but the important point to remember is that even with low correlation the revised data set appears to produce a better TimeWave.
It is probable that the variations we observe in Fig. 20 are the result of both the distortion of the information content of the 384 number data set, as a result of mathematical errors, and the low data wave sampling rate that occurs for short duration TimeWaves (an unexamined but plausible thesis). It is also important to point out here, that when we do see significant differences in the TimeWaves generated by the standard and revised data sets, those differences have revealed a revised TimeWave of greater apparent accuracy. However, it is important that we examine a significant variety of additional TimeWave periods, to gather more statistics on the functioning of the revised wave; but the data in hand so far, seem to be suggesting that the mathematical formalization of the data set generating process, does improve the TimeWave accuracy.
Another significant feature of the revised data correlation plot in Fig. 20 that should be mentioned here, is the fact that the correlation coefficient for the 1915 period is nearly -1, signifying an anti-correlation or mirror image relationship between the waves. This is the TimeWave comparison that is shown if Fig. 18. If one were to place an imaginary two-sided mirror between the standard and revised TimeWave graphs, then the reflection on either side of the mirror would closely resemble the wave that is on the other side - hence the description of anti-correlation as a mirror image relationship. Also notice, that a green dotted line marks the average of all the standard/revised wave correlations at about 70%.
The red line of Fig. 20 shows the correlation of the random number generated waves, with the standard data set. By definition, the random data sets should show little or no correlation with either the standard or revised data sets, nor with any other random number set. In several cases in Fig. 20, this turns out to be true, but there are also several cases in which the random set correlation is not near zero, contrary to expectation. In general, the red line plot of Fig. 20 shows a much lower level of correlation with the standard number set than does the revised set - as expected. Each data point on the red line, however, is actually an average of either two, or seven random number set correlations. In other words, either two or seven random number correlations were averaged to produce each point on the red line graph. It turns out that most of the sixteen correlation points produced by averaging only two random sets, have much more scatter than do the four points produced by averaging seven random set correlations. The 384 number random data set, and the periods 1895-1925, 1905, and 1915, were all produced by averaging seven random set correlations. The violet dotted line running through the random number set correlations, is the average correlation level for all the random sets shown, and it shows a very low average correlation of about 5%.
It is also possible that the same process proposed for producing the larger correlation scatter of the revised data set, could be at work for the random data sets - i.e. short duration time periods with low sampling frequencies, could be causing data scatter due to noise. If a small number of the 384 data file points are used to generate a short period TimeWave, then there is a much higher probability of correlation between the random sets and the TimeWave number sets. Without further investigation, however, this is a speculative, if plausible thesis.
The graphs of Fig. 20 do show that the standard and revised data sets and their derivativeTimeWaves are remarkably well correlated. In the regions where the correlation weakens, or breaks down entirely, the revised TimeWave appears to show a Novelty process that is in closer agreement with known historical process. In addition, the plots in Fig. 20 may be revealing a process whereby short period TimeWaves produce sampling noise that weakens the correlation. This data supports the view, that the information content of the standard TimeWave is somewhat distorted, but not destroyed; and suggests that the revised TimeWave and its piecewise linear function is able to correct this distortion, and provides an improved expression of the Novelty process.
Concluding Remarks
The development of the 384 number data set from the set of First Order of Difference (FOD) integers has been expressed as a process that is piecewise linear in nature. This process involves the combination and expansion of straight-line segments, which can be expressed mathematically as a piecewise linear function. The standard development has been described by McKenna and Meyer in the TimeWave Zero documentation and in other reports. But this process includes a procedural step called the "half twist", that is not consistent with the structure of piecewise linear mathematics; and consequently produces a distortion of the FOD information content. Watkins elaborated on this in some detail, in his well-documented expose on the nature of the half twist, in which he described the distortions and inconsistencies involved. He then concluded that this distortion would render the TimeWave meaningless, as a realistic graphical depiction of the Novelty process as had been described by McKenna. I maintain that this conclusion was premature, and apparently incorrect.
The revised development of the 384 number data set includes the use of mathematics that correctly expresses the piecewise linear development process, and therefore produces an undistorted expansion of the FOD number set. The TimeWave that results from this expansion process, is then an accurate reflection of the FOD number set, provided the set can be described or modeled by a piecewise linear function. The piecewise linear function described here, may only be an approximation to some more complex function that has yet to be found. In fact, I would argue that this is quite likely for a phenomenon or process of this nature, which further study may shed some light on. Nonetheless, if the revised TimeWave is a reasonably accurate reflection of the information content of the FOD number set, then the standard TimeWave should have a degree of accuracy proportional to its degree of correlation with the revised TimeWave. As we have seen thus far, these two TimeWaves show an average correlation of about 70%, so that the standard wave has an average accuracy of about 70% when compared with the revised wave. However, we have also seen this correlation as high as 98%, or as low as 6%, with one case of a mirror image or anti-correlation of -0.94.
This work has served to clarify and formalize the process by which the 384 number TimeWave data set is generated. This has been done by showing that the process is describable within the framework of piecewise linear mathematics in general, and vector mathematics in particular. Each step has been delineated and formalized mathematically, to give the process clarity and continuity. The formalized and revised data set serves as the foundation of the TimeWave generated by the TimeWave Zero software, which is viewed as a graphical depiction of a process described by the ebb and flow of a phenomenon called Novelty. Novelty is thought to be the basis for the creation and conservation of higher ordered states of complex form in nature and the universe.
The results reported here make no final claims as to the validity of the TimeWave as it is expressed by Novelty Theory, nor does it claim that the current TimeWave is the best description of the Novelty process. It does show that the proper mathematical treatment of the FOD number set, produces a TimeWave that appears to be more consistent with known historical process. This consistency is general, however, and more work needs to be done to examine the specific reflections or projections that the TimeWave may be revealing. If Novelty Theory is a valid hypothesis, reflecting a real phenomenon in nature, then one would expect that it is verifiable in specific ways.
It has also seemed appropriate to examine some of the steps in this wave development process in terms of their correspondence with elements of philosophy and science. The flow of Yin and Yang energy reflected in the expression of the forward and reverse bi-directional waves, for example, finds philosophical correspondence in a natural cycle of life-death-rebirth, or in the process of the shamanic journey - immersion, engagement, and return. Correspondence can also be found in science, in the fields of cosmology, astronomy, astrophysics, and quantum physics - the life cycles and motion of heavenly bodies, quarks, and universes; the harmonic and holographic nature of light and wave mechanics; and the cyclic transformation of matter to energy, and energy to matter. The reflection of all natural phenomena and processes over the continuum of existence, from the smallest scales up to the largest scales, must surely include whatever process is occurring in the I-Ching as well. The question is, are we are clever and conscious enough to decipher and express it correctly and appropriately?
Acknowledgements
I would like to thank Terence McKenna, for bringing this intriguing and provocative notion into the collective, and for the courage and foresight shown, by his willingness to open himself and his ideas to scrutiny and boundary dissolution. If there is any relevance or meaning to be found in the TimeWave or Novelty Theory, then it is surely something that is larger than he, or any of us; and it is also something that is properly in the domain of all human experience, with each of us a witness, participant, and contributor.
I would also like to express my thanks and appreciation to Mathew Watkins for his work in exposing the mathematical inconsistencies, vagaries, and procedural errors of the standard TimeWave data set development, and challenging a theory that may have become far too sedentary and inbred for its own good. Whatever the final outcome of this endeavor of Novelty Theory, he has set the enterprise on its proper course of open and critical inquiry.
I am also greatly indebted to Peter Meyer for his skill and foresight in creating a TWZ software package that is flexible, accessible, and friendly to the serious investigator. Without his DOS version of TimeWave Zero software, this work would have been much more difficult if not impossible. He has created a software package that makes these notions realistically testable, in a relatively straightforward manner. This made it possible for me to examine the effects of the revised data set on the TimeWave itself, as well as facilitating the examination of the detailed structure of the wave in work to follow.
My thanks also to Dan Levy for his offer to publish this
work on his Levity site,
as well as hosting an upcoming TimeWave mathematical annex to Novelty
Theory. I want also to acknowledge Brian Crissey at Blue
Water Publishing for his help in integrating the new process into the
TimeWave Zero software packages and documentation.
[John Sheliak] sheliak@dsrt.com
[Terence McKenna] syzygy@ultraconnect.com
[return to
Levity] http://www.levity.com/eschaton/