The earliest arrangement of the hexagrams of the I Ching is the King Wen
Sequence. It was this sequence that I chose to study as a possible basis for
a new model of the relationship of time to the ingression and conservation of
novelty. In studying the kinds of order in the King Wen Sequence of the I
Ching I made a number of remarkable discoveries. It is well known that
hexagrams in the King Wen sequence occur in pairs. The second member of each
pair is obtained by inverting the first. In any sequence of the sixty-four
hexagrams there are eight hexagrams which remain unchanged when inverted. In
the King Wen Sequence these eight hexagrams are paired with hexagrams in which
each line of the first hexagram has become its opposite, (yang changed to yin
and vice -versa).
The question remains as to what rule or principle governs the arrangement of
the thirty-two pairs of hexagrams comprising the King Wen Sequence. My
intuition was to look at the first order of difference, that is, how many lines
change as one moves through the King Wen Sequence from one hexagram to the
next. The first order of difference will always be an integer between one and
six. When the first order of difference within pairs is examined it is always
found to be an even number. Thus all instances of first order of difference
that are odd occur at transitions from one pair of hexagrams to the next pair.
When the complete set of first order of difference integers generated by the
King Wen Sequence is examined they are found to fall into a perfect ratio of 3
to 1, three even integers to each odd integer. The ratio of 3/1 is not a
formal property of the complete sequence but was a carefully constructed
artifact achieved by arranging hexagram transitions between pairs to generate
fourteen instances of three and two instances of one. Fives were deliberately
excluded. The fourteen threes and two ones constitute sixteen instances of an
odd integer occurring out of a possible sixty-four. This is a 3/1 ratio
exactly.

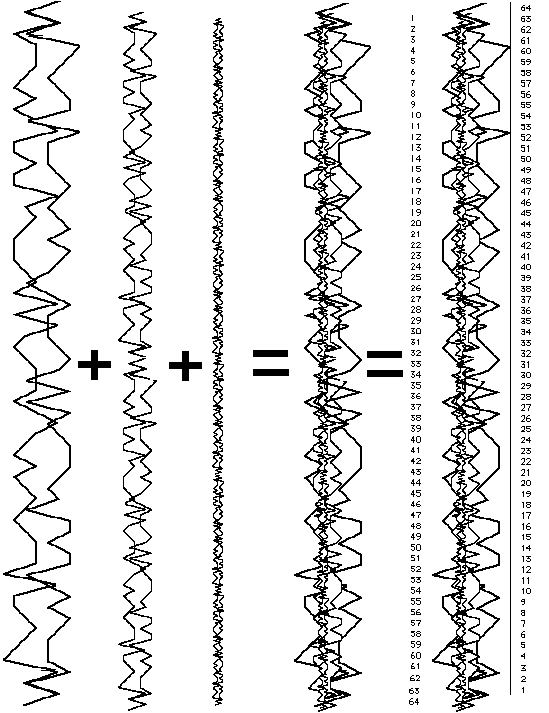
Figure 1
Figure 1 shows that when the first order of difference of the King Wen Sequence
is graphed it appears random or unpredictable. However when an image of the
graph is rotated 180 degrees within the plane and superimposed upon itself it
is found to achieve closure at four adjacent points as in Figure 2.

Figure 2
While closure might logically be expected anywhere in the sequence, it in fact
occurs at the conventional beginning and end of the sequence. While an
arrangement with closure might have placed any two hexagrams opposite each
other, what we in fact find is that the hexagrams opposite each other are such
that the numbers of their positions in the King Wen Sequence when summed is
always equal to sixty-four. These facts are not coincidences, they are the
artifacts of conscious intent.
Over 27,000 hexagram sequences were randomly generated by computer (all
sequences having the property possessed by the King Wen sequence that every
second hexagram is either the inverse or the complement of its predecessor).
Of these 27,000 plus sequences only four were found to have the three
properties of a 3/1 ratio of even to odd transitions, no transitions of value
five and the type of closure described above. Such sequences were found to be
very rare, occurring in a ratio of 1 in 3770. Here is the complete graph of
the King Wen first order of differnce with its mirror image fitted against it
to achieve closure:

Figure 3
For these reasons I was led to view the King Wen Sequence as a profoundly
artificial arrangement of the sixty-four hexagrams. Look carefully at Figure 3
immediately above. Review in your mind the steps from the King Wen sequence
that led to it. Notice that it is a complete set of the sixty-four possible
hexagrams, running both sequentially forward and backward. Since it is
composed of sixty-four hexagrams of six lines each it is composed of 6 x 64 or
384 lines or yao. One might make an analogy and say Figure 3 is to the King
Wen sequence as a cube is to a square; it is composed of the same elements as
the King Wen Sequence but it has more dimensions.
It is my assumption that the oracle building pre-Han Chinese viewed the
forward-and backward-running double sequence of Figure 3 as a single yao or
line and that it is therefore open to the same treatment as lines are subject
to in the I Ching, namely multiplication by six and sixty-four.

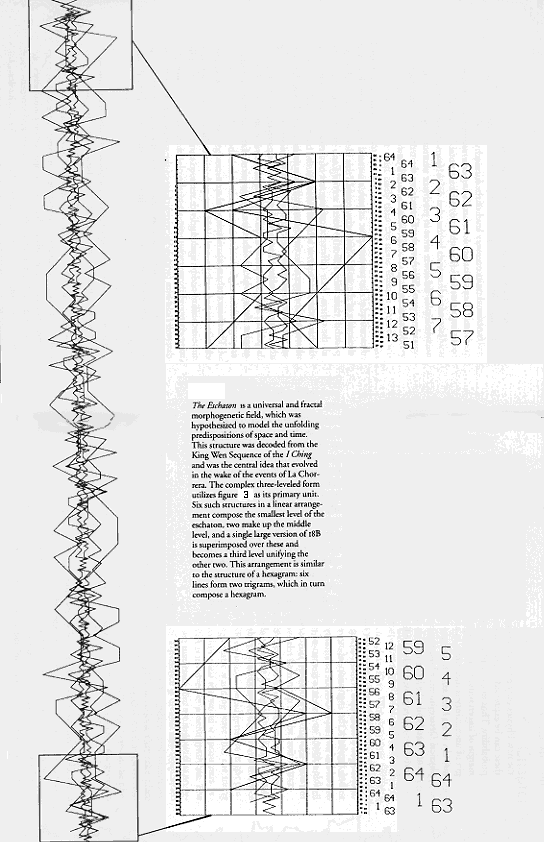
Figure 4
Since a hexagram has six lines I visualized six double sequences in a linear
order. But a hexagram is more than lines; a hexagram also contains two
trigrams. Thus over the six double sequences I overlaid two double sequences,
each three times larger than the six double sequences. A hexagram also has an
identity as a whole; thus over the six and the two double sequences a single,
larger double sequence is projected.
The sets of double sequences of each level share a common point of origin and
all return to a single end point. The resulting figure, show in Figure 4 on the
extreme right, is to the original double sequence as a tesseract is to a cube,
for again more dimensions have been added. This figure itself can then be
imagined as a single hexagram, but one of a set of sixty-four.

Figure 5
The closure at the beginning and end of this figure suggested that it might be
useful to model process. Its 384 subunits imply a calendar. Can it be
coincidence that the length of a lunar month, 29.53 days, times 13 is 383.89?
I believe that what we have here is a 384 day lunar calendar with resonances to
other other naked eye astronomical phenomena known to be of interest to the
ancient Chinese (see below).

Table 1
Using techniques that I developed for the problem I was able to mathematically
collapse the hexagram construct into a self-similar fractal curve that can be
used to map the unfolding of temporal variables and their resonances on all
levels of duration.
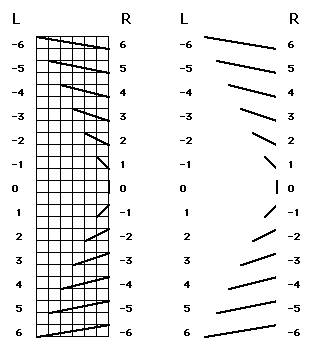
My attack on the problem began with an examination of the simple wave of
Figure 3. Thirteen discrete line types comprise any simple version of the
graph. These thirteen lengths are displayed on and off grid in Figure 6:

Figure 6
. As these lengths are always discrete units, we can assign to them values
which are ascending integers. The values of Figure 6 allow a quantification of
line length. To quantify the degree and direction of skew of individual lines,
one direction of skew is designated as positive, giving lines skewed in that
direction positive values. Lines skewed in the opposite direction are given
negative values. This gives values adequately preserving and quantifying line
length and direction of skew. The values labeled L in Figure 6 are used for
the left side of a simple wave while the values labeled R, which are the same
values with their their sign reverse, are applied to the right side of any
simple wave. The sign is important only in combining values across scales but
is ignored in the final graphing of combine values, either set of values may be
applied to either the right or left side. However, whichever schema is chosen
must then be followed throughout. Figure 7 represents the version of these
values that we have used for the simple graph.

Figure 7
It is important to note that the valuations in Figure 7 are valuations of
the simple wave on the smallest scale of a single complex wave. The relative
proportions of the three levels in the complex wave are preserved and
quantified by multiplying the valuations of the linear scale in the appropriate
way. To assign a value to a position╩on the trigramatic scale, the valuation
of that position on the linear scale (Figure 7) is multiplied by three because
the trigramatic scale is three times larger than the linear scale. In a
similar manner, the hexagramatic╩positions are assigned a valuation by
multiplying their linear-level valuations by six, again because the
hexagramatic╩scale is six times larger than the linear. Figure 7 uses the
value scheme in Figure 6 and is the version of value assignments we have used
in all our calculations.
Note that in Figure 7 all parallel lines, regardless of the distances
separating them, reduce to zero. Thus, while the operations discussed so far
have allowed quantification of skew direction, proportional ratios of the wave
parts, and the degree of departure from the parallel state, they have not
provided a quantified account of the fluctuating distances between the two
parameters of the wave. The procedure for obtaining these values is similar
to, but distinct from, the procedures outlines above.

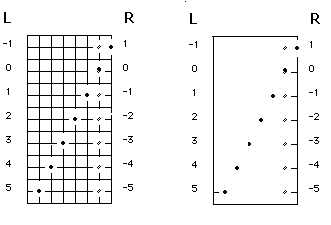
Figure 8
Figure 8 shows the seven types of divergence, congruence, and overlap which
points in the simple wave may display. The two possible assignments of
positive and negative numbers are shown to the right and left sides in Figure
8. ╩ We have chosen to use the right-hand schema to preserve the intuition
that overlap tends to carry a situation toward the zero state rather than away
from it.

Figure 9
Figure 9 shows the values this series of point assignments generates when
applied to the simple wave. When the valuations for skew, parallelism, and
relative proportion have been combined in the manner detailed above the
following 384 values result(as read from position 383 to position zero):
0, 0, 0, 2, 7, 4, 3, 2, 6, 8, 13, 5, 26, 25, 24, 15, 13, 16, 14, 19,
17, 24, 20, 25, 63, 60, 56, 55, 47, 53, 36, 38, 39, 43, 39, 35, 22, 24, 22, 21,
29, 30, 27, 26, 26, 21, 23, 19, 57, 62, 61, 55, 57, 57, 35, 50, 40, 29, 28, 26,
50, 51, 52, 61, 60, 60, 42, 42, 43, 43, 42, 41, 45, 41, 46, 23, 35, 34, 21, 21,
19, 51, 40, 49, 29, 29, 31, 40, 36, 33, 29, 26, 30, 16, 18, 14, 66, 64, 64, 56,
53, 57, 49, 51, 47, 44, 46, 47, 56, 51, 53, 25, 37, 30, 31, 28, 30, 36, 35, 22,
28, 32, 27, 32, 34, 35, 52, 49, 48, 51, 51, 53, 40, 43, 42, 26, 30, 28, 55, 41,
53, 52, 51, 47, 61, 64, 65, 39, 41, 41, 22, 21, 23, 43, 41, 38, 24, 22, 24, 14,
17, 19, 52, 50, 47, 42, 40, 42, 26, 27, 27, 34, 38, 33, 44, 44, 42, 41, 40,
37, 33, 31, 26, 44, 34, 38, 46, 44, 44, 36, 37, 34, 36, 36, 36, 38, 43, 38, 27,
26, 30, 32, 37, 29, 50, 49, 48, 29, 37, 36, 10, 19, 17, 24, 20, 25, 53, 52, 50,
53, 57, 55, 34, 44, 45, 13, 9, 5, 34, 26, 32, 31, 41, 42, 31, 32, 30, 21, 19,
23, 43, 36, 31, 47, 45, 43, 47, 62, 52, 41, 36, 38, 46, 47, 40, 43, 42, 42, 36,
38, 43, 53, 52, 53, 47, 49, 48, 47, 41, 44, 15, 11, 19, 51, 40, 49, 23, 23, 25,
34, 30, 27, 7, 4, 4, 32, 22, 32, 68, 70, 66, 68, 79, 71, 43, 45, 41, 38, 40,
41, 24, 25, 23, 35, 33, 38, 43, 50, 48, 18, 17, 26, 34, 38, 33, 38, 40, 41, 34,
31, 30, 33, 33, 35, 28, 23, 22, 26, 30, 26, 75, 77, 71, 62, 63, 63, 37, 40, 41,
49, 47, 51, 32, 37, 33, 49, 47, 44, 32, 38, 28, 38, 39, 37, 22, 20, 17, 44, 50,
40, 32, 33, 33, 40, 44, 39, 32, 32, 40, 39, 34, 41, 33, 33, 32, 32, 38, 36, 22,
20, 20, 12, 13, 10

Figure 10
Figure 10 shows the complex compound wave and its reduction into an ordinary
graph. The 384 values above can be ploted on a graph thus reducing the
complex, tri-leveled, bi-directionally flowing complex wave a single line
moving in only one direction. Such a graph preserves certain qualities of the
complex wave: its divergence from the zero state where lines are parallel, the
direction and degree of skew of pairs of lines, the relative proportions of the
three levels, and the distances between the fluctuating parameters of the
various component waves. However such a graph does not reflect the shift of
values that would occur if the single-line complex wave were nested into a
particular position in the modular hierarchy of fractal waves each level of
which was 64 times larger than its predecessor. In such a case, the 384 values
above would serve as a schema of values to be combined through superimposition
with the values associated with whichever one of the 64 segments of the next
largest level it is to be nested in. These latter values have first been
multiplied by by 64, indicating their membership in the next larger level of
the hierarchy. Thus 64 variants of the values of Table 2 would be generated,
and it is these various waves or frames which we treat as comprising the
temporal maps of a given historical span. The values of Table 2 are the basis
of the quantified maps of temporal flux which Novelty theory rests on.

Figure 11
The last three of the 384 segments of the wave on any level possess
singularities which quantify as zero, see Figure 11. When the wave on a given
level enters those segments of itself which are zero states, it ceases to
contribute boundary constraints to its subsets on lower levels. The cessation
of boundary constraints imposed by higher levels in the hierarchy causes a
"surge" toward the zero state each time that a cycle enters its terminal phase
on any level in the hierarchy. Such quantized transitions from one modality to
another are called "changes of epoches" By Whitehead. The appearance of life
in an inorganic world, of consciousness in an unconscious world, or of language
in a world without language are all examples of such epochal transitions. Our
lives are filled with such transitions, but they are terminations of relatively
short cycles in the quantified hierarchy. Terminations of cycles or epoches of
really long duration cause extreme accelerations toward the zero state/ This
idea is similar to Whitehead's conception of concrescence and the Vedic
conception of world ages which grow shorter as they tighten around an axis
point. The spiral image of the Christian apocalypse is another example of this
intuition that time is a series of tightening gyres around the quantized
emergence of transformation.
A perfect self-consistent proof that Table 2 does adequately conserve four
qualities--divergence from the zero state where lines are parallel, the
direction and the degree of skew of pairs of lines, distances between the
parameters of the component waves, and the proportions of these three qualities
relative to the other levels--is afforded by comparing any two graph segments
assigned to a single time but on different scales relative to an arbitrary
termination date that is the same for both. Any two such segments will be
found to be similar in form yet preserving their relative proportions. This
demonstrable fact confirms the idea that the complex wave derived from Figure 3
is adequately reflected and its useful values retained throughout the series of
operations which generate Table 2. What Table 2 and the graphs made from it
achieve is a clarity and simplicity of expression lacking in the tri-leveled
complex wave. Table 2 and the algorithm that accompanies it is a
quantification of operational constructs which makes this modular hierarchy of
temporal variables a valid subject for rigorous scientific investigation.
people
have accessed this page since 30 October.